

The Top Data Analytics Tools in 2025
Level up your Data game with the definitive list of Data Analytics tools in 2025


Business Intelligence & Visualization
 Tableau
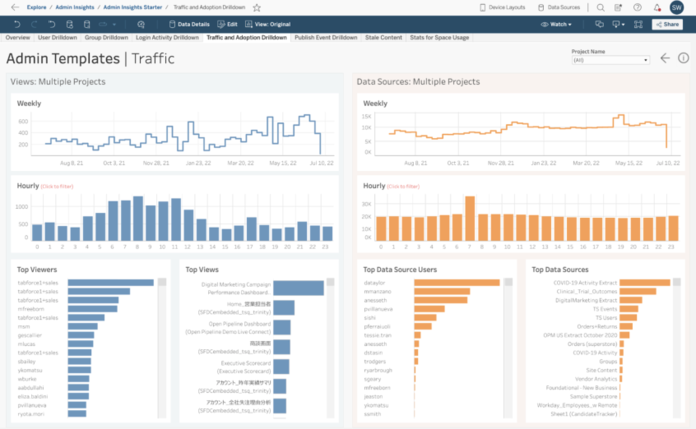
Key Features
- Interactive and shareable dashboards
- Real-time data analysis
- Integration with multiple data sources
- Advanced analytics with R and Python integration
- Mobile-friendly visualizations
Tableau is a leading data visualization tool that helps analysts turn raw data into comprehensible insights. Its drag-and-drop interface allows for the creation of interactive dashboards without extensive coding. Tableau supports a vast array of data sources, making it versatile for various analytical needs.
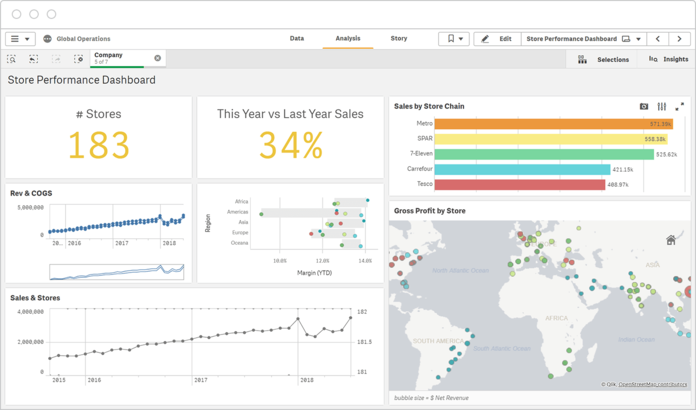
 Looker (Google Cloud)
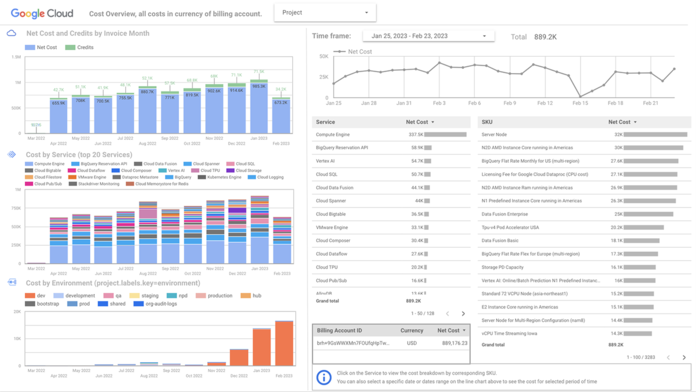
Key Features
- Centralized data modeling with LookML
- Real-time data exploration
- Customizable dashboards and reports
- Integration with Google BigQuery and other databases
- Collaborative data analysis
Looker is a business intelligence tool that offers data exploration and visualization capabilities. It uses LookML, a modeling language, to create a centralized data model, ensuring consistency across analyses. Looker also integrates seamlessly with Google Cloud and other databases.
 IBM Cognos Analytics
Key Features
- AI-assisted data exploration
- Interactive dashboards and reports
- Natural language querying
- Integration with various data sources
- Mobile accessibility
IBM Cognos Analytics is an AI-infused business intelligence platform that supports the entire analytics cycle, from discovery to operationalization. It enables users to create dashboards and reports, and its AI capabilities assist in data exploration and pattern detection.
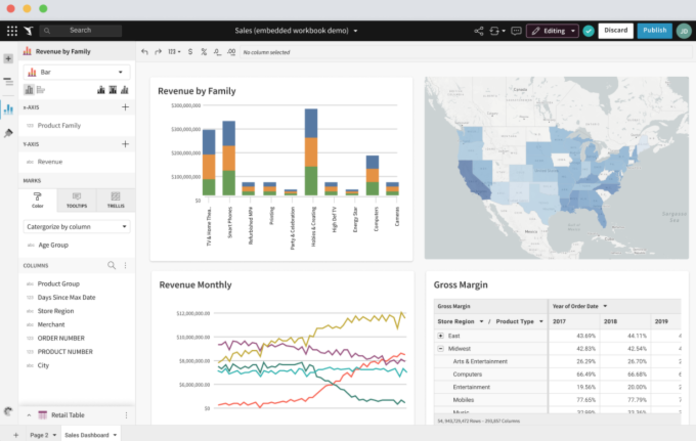
 Domo
Domo
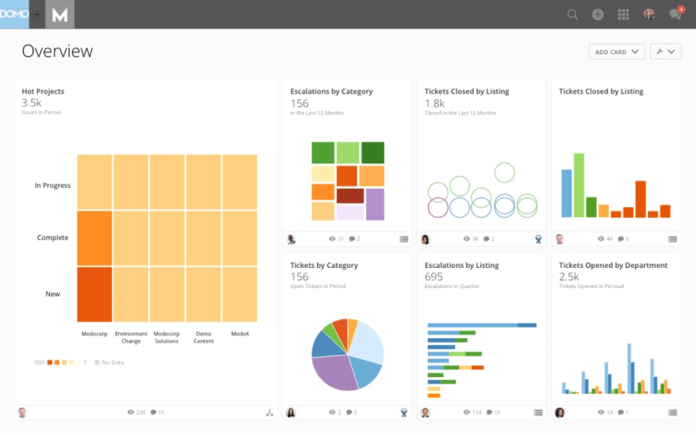
Key Features
- Real-time data dashboards
- Over 1,000 pre-built data connectors
- Mobile accessibility for on-the-go insights
- Drag-and-drop data transformation tools
- Collaborative features for team-based analysis
Domo is a cloud-based business intelligence platform that offers real-time data visualization and dashboards. It allows analysts to connect, prepare and visualize data from various sources. Domo's user-friendly interface makes it accessible for users without extensive technical backgrounds.
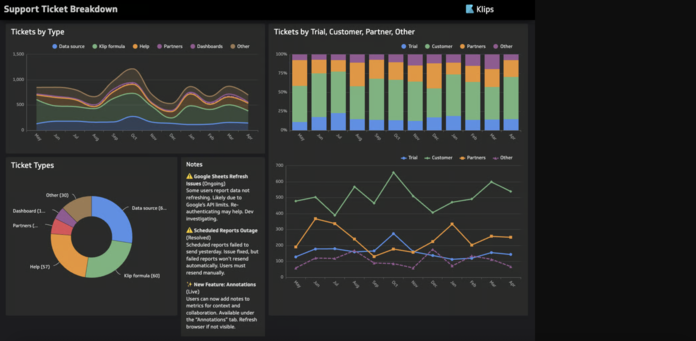
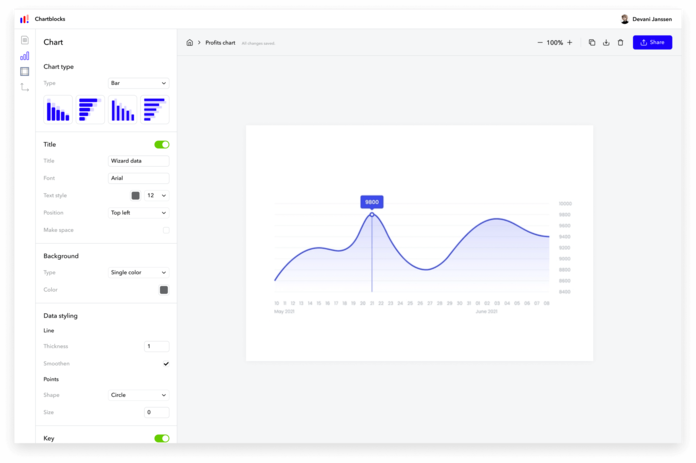
 ChartBlocks
Key Features
- Easy-to-use chart design wizard
- Import data from spreadsheets and databases
- Customizable chart styles and colors
- Responsive charts for different devices
- Export options for web and print
ChartBlocks is an online chart builder that allows users to design and share charts quickly. It offers a simple interface for creating various types of charts. This tool is ideal for users needing straightforward charting solutions.
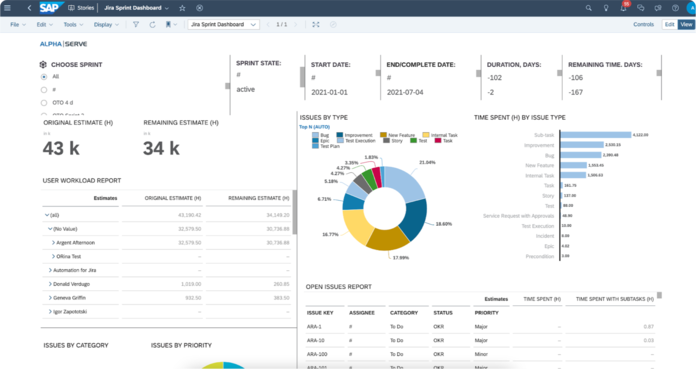
 SAP Analytics Cloud
Key Features
- Integrated planning and analytics capabilities
- Smart insights powered by machine learning
- Real-time data connectivity
- Collaborative features for shared decision-making
- Mobile access for analytics on the go
SAP Analytics Cloud combines business intelligence, planning and predictive analytics in a single cloud environment. It allows analysts to create interactive dashboards and perform ad-hoc analysis. The platform integrates seamlessly with other SAP products and various data sources.
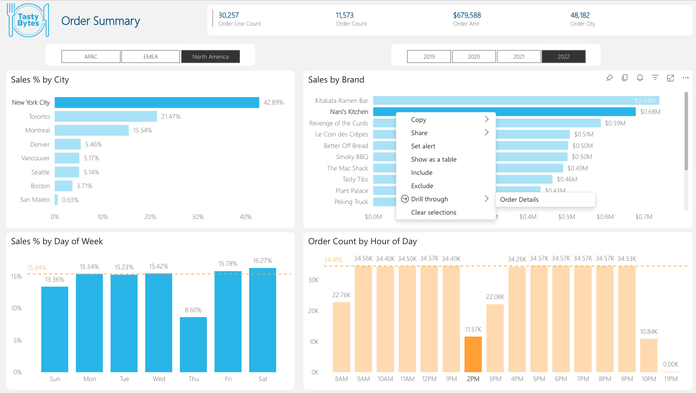
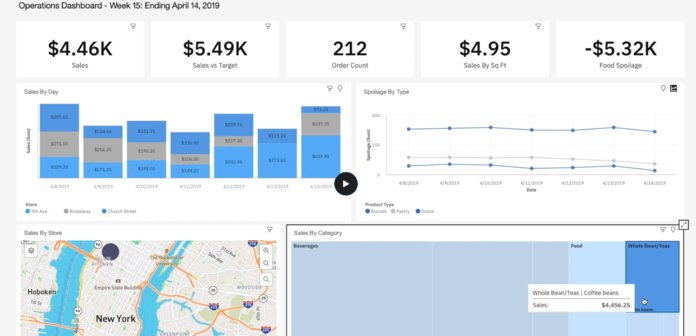
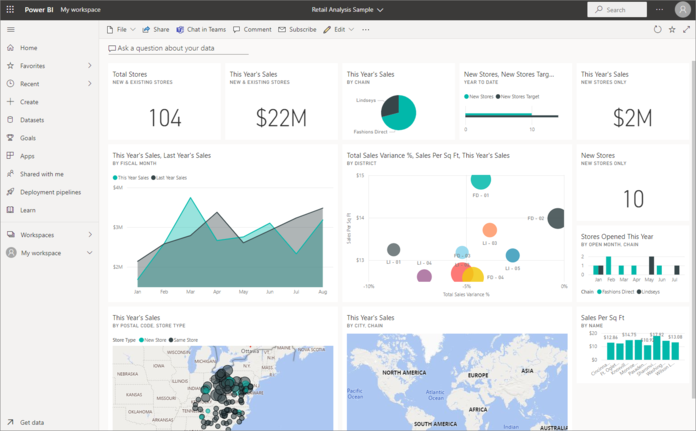
 Microsoft Power BI
Key Features
- Interactive dashboards and reports
- Integration with Excel and Azure
- AI-powered data insights
- Custom visualizations
- Real-time data monitoring
Microsoft Power BI is a business analytics tool that enables data analysts to visualize and share insights across their organization. It connects to a wide range of data sources and simplifies data preparation and analysis. With its integration into the Microsoft ecosystem, it offers seamless collaboration and real-time dashboard updates.