

The Top Data Analytics Tools in 2025
Level up your Data game with the definitive list of Data Analytics tools in 2025
All Tools
 Alteryx
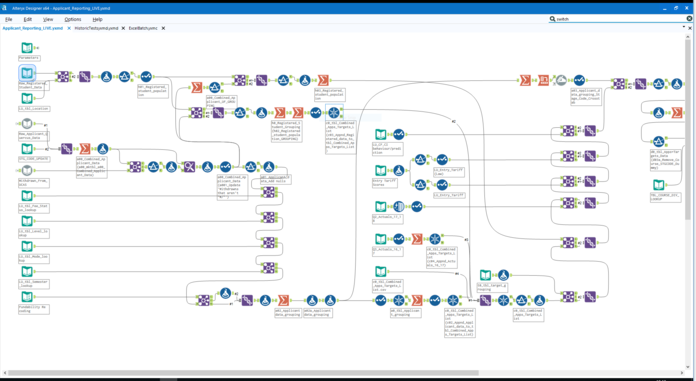
Key Features
- Data blending and preparation
- Predictive analytics and machine learning
- Integration with various data sources
- Automated workflows
- Spatial analytics capabilities
Alteryx is a data analytics platform that enables users to prepare, blend and analyze data from various sources. It offers a user-friendly interface that allows analysts to perform complex data tasks without the need for coding. Alteryx is known for its speed and efficiency in data processing.
 ThoughtSpot

Key Features
- Natural language search for data queries
- AI-driven insights and recommendations
- Interactive dashboards and visualizations
- Integration with various data sources
- Scalability for large datasets
ThoughtSpot is a search and AI-driven analytics platform. It allows users to ask questions in natural language and get instant insights. ThoughtSpot is designed for business users to explore data without relying on analysts.
 Qlik Sense
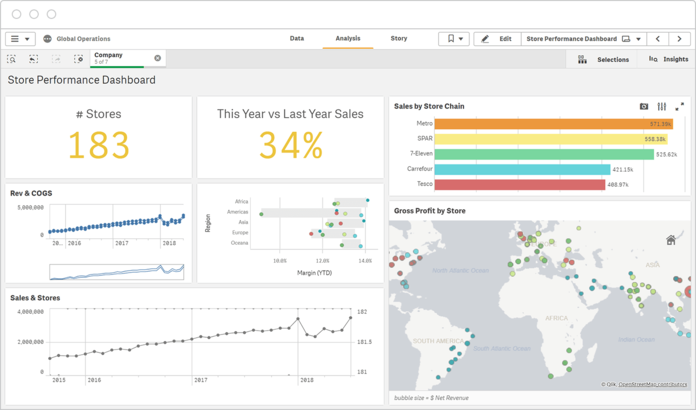
Key Features
- Associative data model for intuitive exploration
- Smart visualizations and AI-powered insights
- Self-service data preparation
- Integration with various data sources
- Scalable multi-cloud architecture
Qlik Sense is a self-service data analytics tool that empowers users to create personalized reports and dashboards. Its associative data engine allows for in-depth data exploration, revealing hidden insights. Qlik Sense supports a range of data sources and offers robust security features.
 Sigma Computing
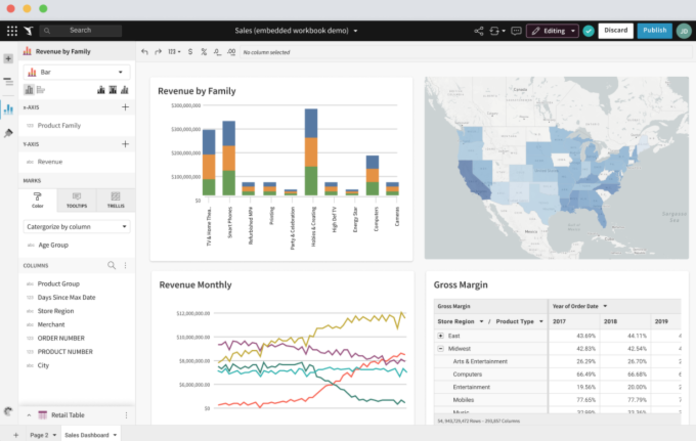
Key Features
- Spreadsheet-like interface
- Live connection to cloud data warehouses
- Real-time collaboration
- No-code data modeling
- Secure data governance
Sigma Computing offers a cloud-native analytics platform that combines the familiarity of spreadsheets with the power of modern BI tools. It allows analysts to perform ad-hoc analyses and build dashboards without writing code.
 Klipfolio
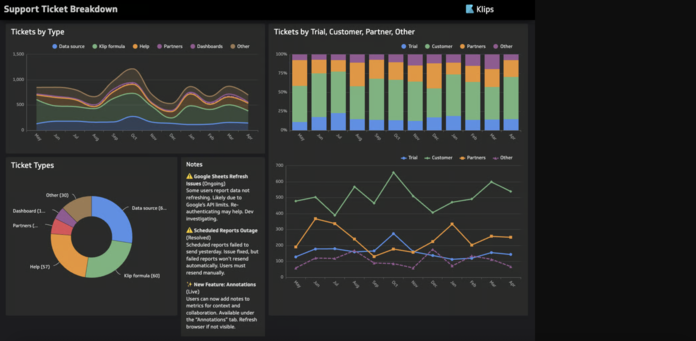
Key Features
- Real-time dashboards with auto-refresh
- Integration with numerous data sources
- Customizable visualizations and metrics
- Sharing and embedding options for dashboards
- Historical data tracking for trend analysis
Klipfolio is a cloud-based dashboard tool that enables analysts to create real-time dashboards and reports. It supports data connections from various services and databases. Klipfolio's intuitive interface allows for quick setup and customization.
 Maltego
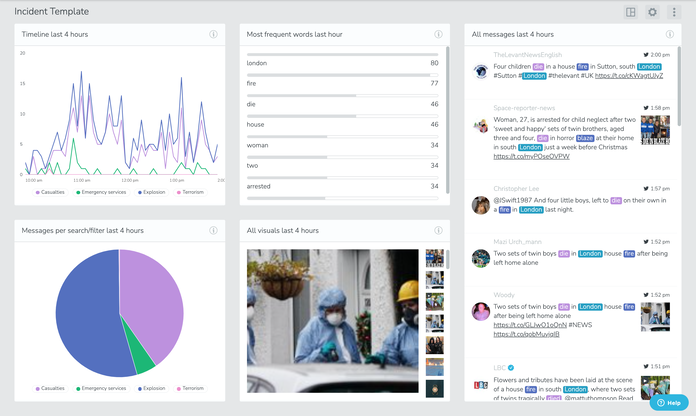
Key Features
- Graph-based link analysis
- Integration with numerous data sources
- Real-time data mining capabilities
- Customizable transforms for data queries
- Collaboration features for team investigations
Maltego is a data mining tool that specializes in link analysis and data visualization. It's widely used in cybersecurity and forensic investigations. Maltego helps analysts discover relationships between entities across various data sources.
 Tableau
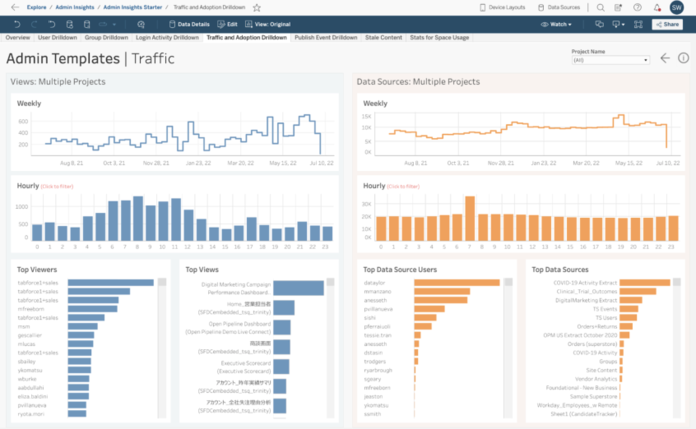
Key Features
- Interactive and shareable dashboards
- Real-time data analysis
- Integration with multiple data sources
- Advanced analytics with R and Python integration
- Mobile-friendly visualizations
Tableau is a leading data visualization tool that helps analysts turn raw data into comprehensible insights. Its drag-and-drop interface allows for the creation of interactive dashboards without extensive coding. Tableau supports a vast array of data sources, making it versatile for various analytical needs.
 Looker (Google Cloud)
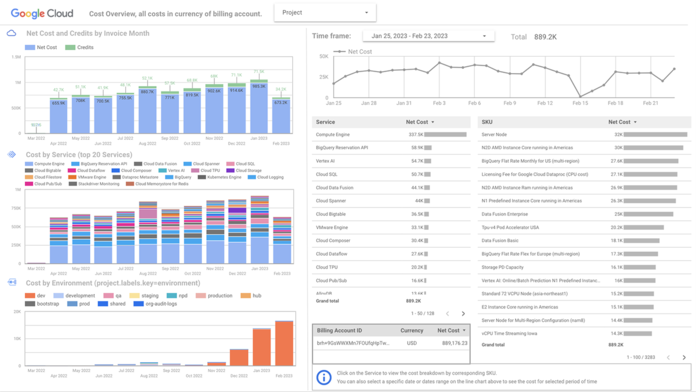
Key Features
- Centralized data modeling with LookML
- Real-time data exploration
- Customizable dashboards and reports
- Integration with Google BigQuery and other databases
- Collaborative data analysis
Looker is a business intelligence tool that offers data exploration and visualization capabilities. It uses LookML, a modeling language, to create a centralized data model, ensuring consistency across analyses. Looker also integrates seamlessly with Google Cloud and other databases.
 IBM Cognos Analytics
Key Features
- AI-assisted data exploration
- Interactive dashboards and reports
- Natural language querying
- Integration with various data sources
- Mobile accessibility
IBM Cognos Analytics is an AI-infused business intelligence platform that supports the entire analytics cycle, from discovery to operationalization. It enables users to create dashboards and reports, and its AI capabilities assist in data exploration and pattern detection.
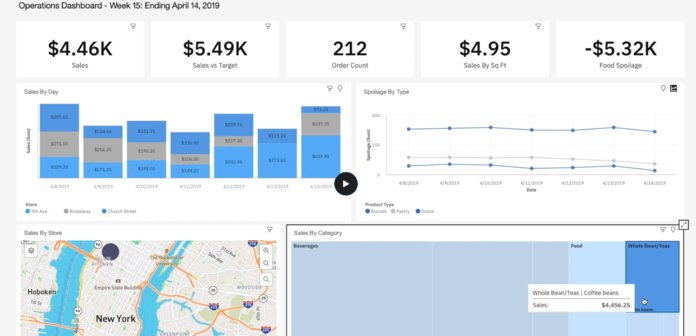
 Domo
Domo
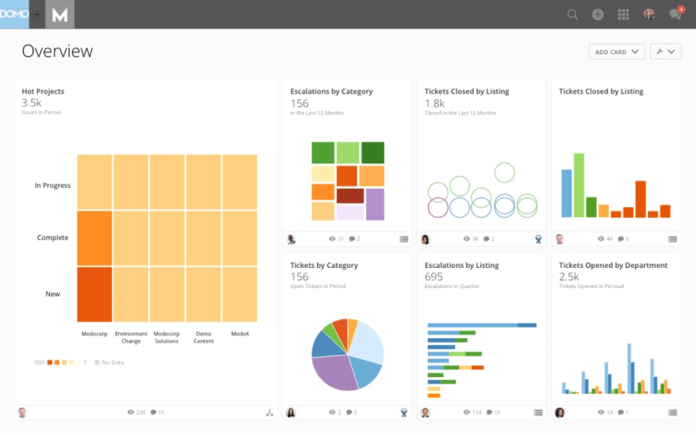
Key Features
- Real-time data dashboards
- Over 1,000 pre-built data connectors
- Mobile accessibility for on-the-go insights
- Drag-and-drop data transformation tools
- Collaborative features for team-based analysis
Domo is a cloud-based business intelligence platform that offers real-time data visualization and dashboards. It allows analysts to connect, prepare and visualize data from various sources. Domo's user-friendly interface makes it accessible for users without extensive technical backgrounds.
 ChartBlocks
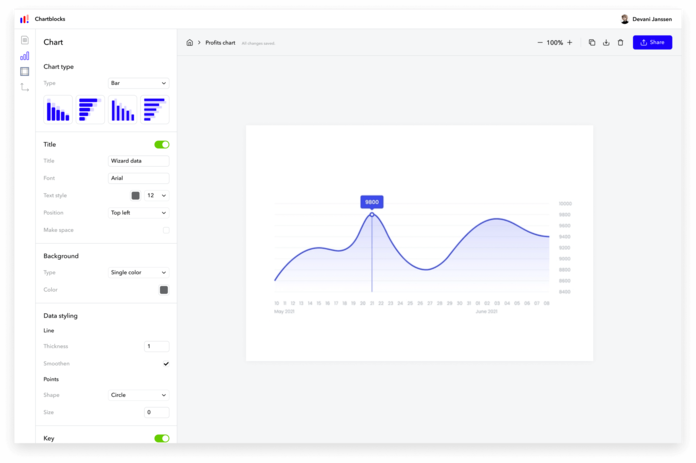
Key Features
- Easy-to-use chart design wizard
- Import data from spreadsheets and databases
- Customizable chart styles and colors
- Responsive charts for different devices
- Export options for web and print
ChartBlocks is an online chart builder that allows users to design and share charts quickly. It offers a simple interface for creating various types of charts. This tool is ideal for users needing straightforward charting solutions.
 SAP Analytics Cloud
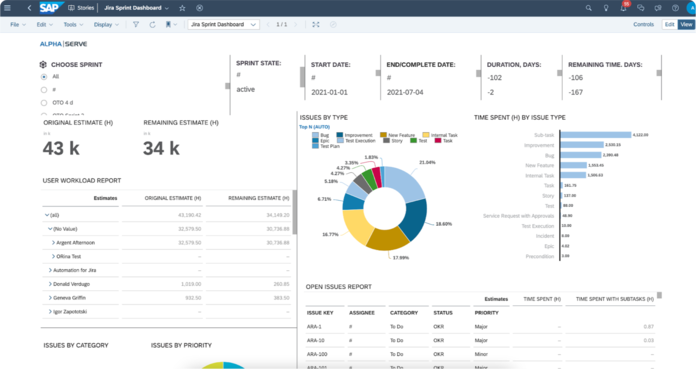
Key Features
- Integrated planning and analytics capabilities
- Smart insights powered by machine learning
- Real-time data connectivity
- Collaborative features for shared decision-making
- Mobile access for analytics on the go
SAP Analytics Cloud combines business intelligence, planning and predictive analytics in a single cloud environment. It allows analysts to create interactive dashboards and perform ad-hoc analysis. The platform integrates seamlessly with other SAP products and various data sources.
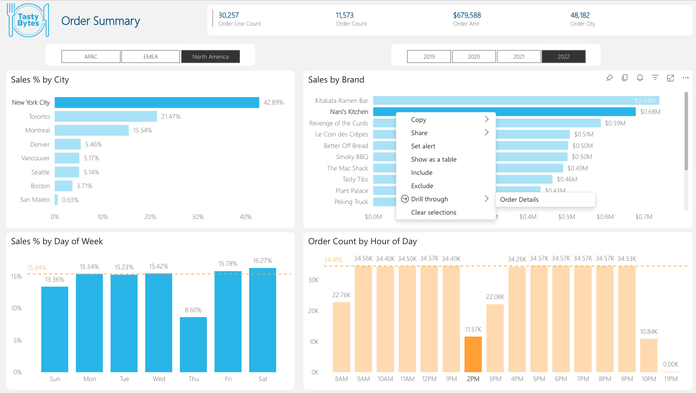
 Microsoft Power BI
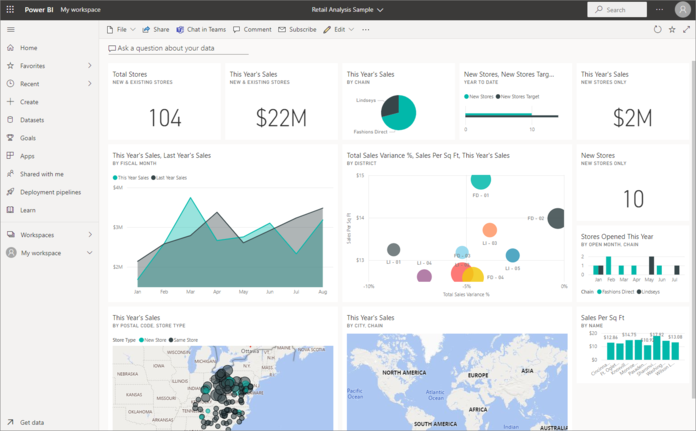
Key Features
- Interactive dashboards and reports
- Integration with Excel and Azure
- AI-powered data insights
- Custom visualizations
- Real-time data monitoring
Microsoft Power BI is a business analytics tool that enables data analysts to visualize and share insights across their organization. It connects to a wide range of data sources and simplifies data preparation and analysis. With its integration into the Microsoft ecosystem, it offers seamless collaboration and real-time dashboard updates.
 Apache Spark
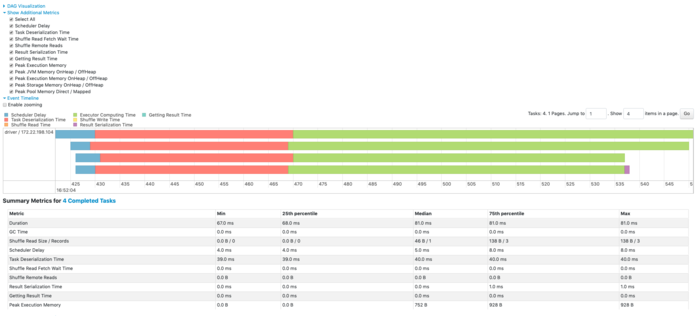
Key Features
- In-memory data processing
- Support for multiple programming languages
- Real-time stream processing
- Machine learning library (MLlib)
- Graph processing capabilities
Apache Spark is an open-source unified analytics engine designed for large-scale data processing. It provides high-level APIs in Java, Scala, Python and R, and supports general computation graphs for data analysis. Spark is known for its speed and ease of use in big data processing.
 KNIME
KNIME
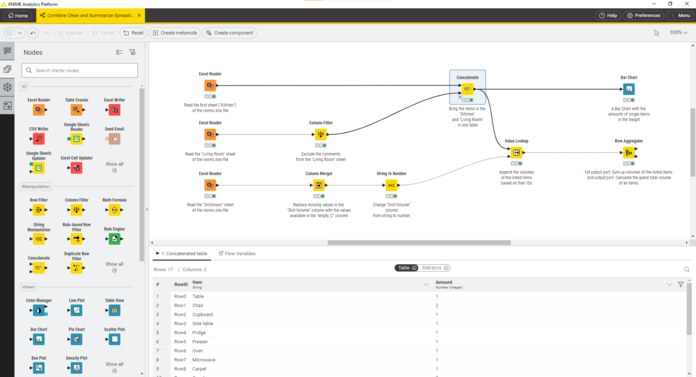
Key Features
- Visual workflow builder
- Integration with Python, R, and other tools
- Extensive library of nodes for data manipulation
- Support for big data and cloud platforms
- Community-driven extensions
KNIME is an open-source platform that integrates various components for machine learning and data mining through its modular data pipelining concept. It allows users to visually create data flows, selectively execute some or all analysis steps and inspect the results, models and interactive views.
 Altair RapidMiner
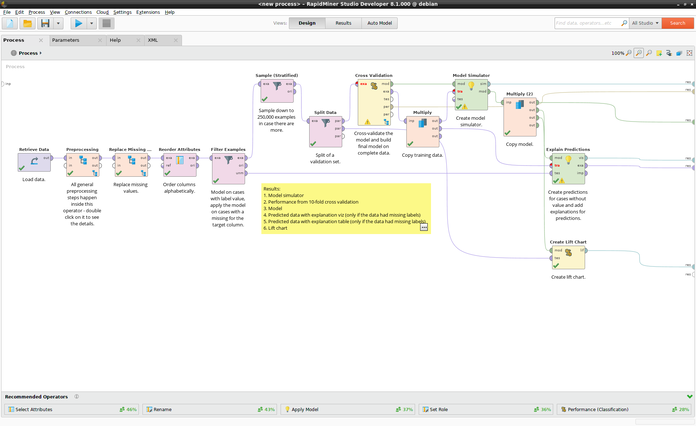
Key Features
- Drag-and-drop visual interface
- Automated machine learning
- Integration with R and Python
- Extensive library of machine learning algorithms
- Support for big data and cloud environments
Altair RapidMiner is a data science platform that provides an integrated environment for data preparation, machine learning, deep learning, text mining and predictive analytics. It is designed for both experienced data scientists and those new to data analysis.
 SAS
SAS
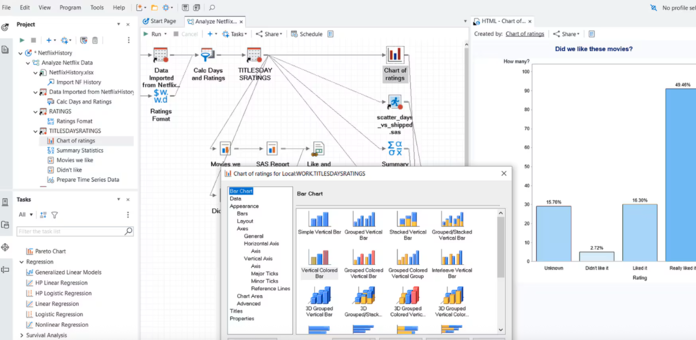
Key Features
- Advanced statistical and predictive analytics
- Data mining and machine learning
- High-performance analytics
- Data management and integration
- Customizable reporting and visualization
SAS is a software suite developed for advanced analytics, multivariate analysis, business intelligence and data management. It is widely used in various industries for its robust statistical analysis capabilities. SAS provides a comprehensive environment for data analysts to perform complex analyses.
 Stata
Stata
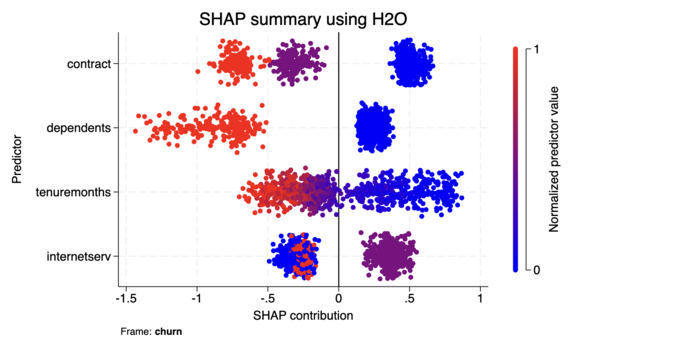
Key Features
- Extensive statistical analysis capabilities
- Data management tools for large datasets
- High-quality graphics for data visualization
- Automation through scripting
- Comprehensive documentation and user community
Stata is a statistical software package used for data management, statistical analysis and graphics. It's widely used in academic and professional research settings. Stata offers a comprehensive suite of statistical tools for data analysts.
 Snowflake
Key Features
- Scalable cloud data warehousing
- Separation of storage and compute resources
- Support for structured and semi-structured data
- Secure data sharing capabilities
- Integration with BI and data integration tools
Snowflake is a cloud-based data warehousing platform that allows for the storage and analysis of large volumes of data. It separates storage and compute, enabling scalable and concurrent data processing. Snowflake supports various data formats and integrates with numerous BI tools.
 Databricks
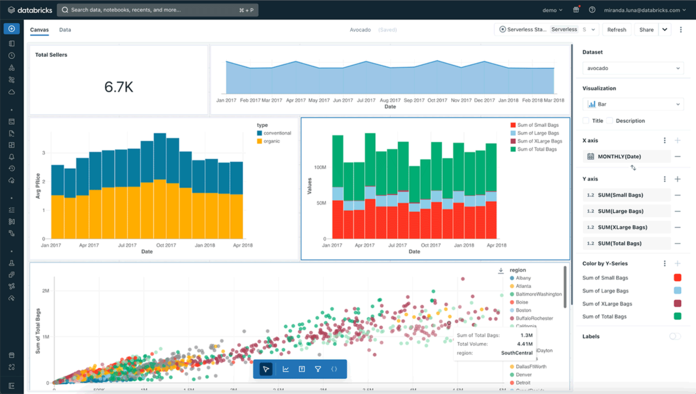
Key Features
- Collaborative notebooks for real-time code sharing
- Integration with Apache Spark for big data processing
- Scalable machine learning workflows
- Support for multiple languages (Python, R, Scala)
- Seamless integration with cloud storage solutions
Databricks is a unified analytics platform designed for big data and machine learning. It integrates with Apache Spark and provides collaborative notebooks for data scientists and engineers. Databricks simplifies the process of building and deploying machine learning models at scale.
Data Preparation & Integration
Alteryx
Key Features
- Data blending and preparation
- Predictive analytics and machine learning
- Integration with various data sources
- Automated workflows
- Spatial analytics capabilities
Alteryx is a data analytics platform that enables users to prepare, blend and analyze data from various sources. It offers a user-friendly interface that allows analysts to perform complex data tasks without the need for coding. Alteryx is known for its speed and efficiency in data processing.
Self-Service Analytics & Dashboards
ThoughtSpot
Key Features
- Natural language search for data queries
- AI-driven insights and recommendations
- Interactive dashboards and visualizations
- Integration with various data sources
- Scalability for large datasets
ThoughtSpot is a search and AI-driven analytics platform. It allows users to ask questions in natural language and get instant insights. ThoughtSpot is designed for business users to explore data without relying on analysts.
Qlik Sense
Key Features
- Associative data model for intuitive exploration
- Smart visualizations and AI-powered insights
- Self-service data preparation
- Integration with various data sources
- Scalable multi-cloud architecture
Qlik Sense is a self-service data analytics tool that empowers users to create personalized reports and dashboards. Its associative data engine allows for in-depth data exploration, revealing hidden insights. Qlik Sense supports a range of data sources and offers robust security features.
Sigma Computing
Key Features
- Spreadsheet-like interface
- Live connection to cloud data warehouses
- Real-time collaboration
- No-code data modeling
- Secure data governance
Sigma Computing offers a cloud-native analytics platform that combines the familiarity of spreadsheets with the power of modern BI tools. It allows analysts to perform ad-hoc analyses and build dashboards without writing code.
Klipfolio
Key Features
- Real-time dashboards with auto-refresh
- Integration with numerous data sources
- Customizable visualizations and metrics
- Sharing and embedding options for dashboards
- Historical data tracking for trend analysis
Klipfolio is a cloud-based dashboard tool that enables analysts to create real-time dashboards and reports. It supports data connections from various services and databases. Klipfolio's intuitive interface allows for quick setup and customization.
Maltego
Key Features
- Graph-based link analysis
- Integration with numerous data sources
- Real-time data mining capabilities
- Customizable transforms for data queries
- Collaboration features for team investigations
Maltego is a data mining tool that specializes in link analysis and data visualization. It's widely used in cybersecurity and forensic investigations. Maltego helps analysts discover relationships between entities across various data sources.
Business Intelligence & Visualization
Tableau
Key Features
- Interactive and shareable dashboards
- Real-time data analysis
- Integration with multiple data sources
- Advanced analytics with R and Python integration
- Mobile-friendly visualizations
Tableau is a leading data visualization tool that helps analysts turn raw data into comprehensible insights. Its drag-and-drop interface allows for the creation of interactive dashboards without extensive coding. Tableau supports a vast array of data sources, making it versatile for various analytical needs.
Looker (Google Cloud)
Key Features
- Centralized data modeling with LookML
- Real-time data exploration
- Customizable dashboards and reports
- Integration with Google BigQuery and other databases
- Collaborative data analysis
Looker is a business intelligence tool that offers data exploration and visualization capabilities. It uses LookML, a modeling language, to create a centralized data model, ensuring consistency across analyses. Looker also integrates seamlessly with Google Cloud and other databases.
IBM Cognos Analytics
Key Features
- AI-assisted data exploration
- Interactive dashboards and reports
- Natural language querying
- Integration with various data sources
- Mobile accessibility
IBM Cognos Analytics is an AI-infused business intelligence platform that supports the entire analytics cycle, from discovery to operationalization. It enables users to create dashboards and reports, and its AI capabilities assist in data exploration and pattern detection.
Domo
Key Features
- Real-time data dashboards
- Over 1,000 pre-built data connectors
- Mobile accessibility for on-the-go insights
- Drag-and-drop data transformation tools
- Collaborative features for team-based analysis
Domo is a cloud-based business intelligence platform that offers real-time data visualization and dashboards. It allows analysts to connect, prepare and visualize data from various sources. Domo's user-friendly interface makes it accessible for users without extensive technical backgrounds.
ChartBlocks
Key Features
- Easy-to-use chart design wizard
- Import data from spreadsheets and databases
- Customizable chart styles and colors
- Responsive charts for different devices
- Export options for web and print
ChartBlocks is an online chart builder that allows users to design and share charts quickly. It offers a simple interface for creating various types of charts. This tool is ideal for users needing straightforward charting solutions.
SAP Analytics Cloud
Key Features
- Integrated planning and analytics capabilities
- Smart insights powered by machine learning
- Real-time data connectivity
- Collaborative features for shared decision-making
- Mobile access for analytics on the go
SAP Analytics Cloud combines business intelligence, planning and predictive analytics in a single cloud environment. It allows analysts to create interactive dashboards and perform ad-hoc analysis. The platform integrates seamlessly with other SAP products and various data sources.
Microsoft Power BI
Key Features
- Interactive dashboards and reports
- Integration with Excel and Azure
- AI-powered data insights
- Custom visualizations
- Real-time data monitoring
Microsoft Power BI is a business analytics tool that enables data analysts to visualize and share insights across their organization. It connects to a wide range of data sources and simplifies data preparation and analysis. With its integration into the Microsoft ecosystem, it offers seamless collaboration and real-time dashboard updates.
Advanced Analytics & Machine Learning
Apache Spark
Key Features
- In-memory data processing
- Support for multiple programming languages
- Real-time stream processing
- Machine learning library (MLlib)
- Graph processing capabilities
Apache Spark is an open-source unified analytics engine designed for large-scale data processing. It provides high-level APIs in Java, Scala, Python and R, and supports general computation graphs for data analysis. Spark is known for its speed and ease of use in big data processing.
KNIME
Key Features
- Visual workflow builder
- Integration with Python, R, and other tools
- Extensive library of nodes for data manipulation
- Support for big data and cloud platforms
- Community-driven extensions
KNIME is an open-source platform that integrates various components for machine learning and data mining through its modular data pipelining concept. It allows users to visually create data flows, selectively execute some or all analysis steps and inspect the results, models and interactive views.
Altair RapidMiner
Key Features
- Drag-and-drop visual interface
- Automated machine learning
- Integration with R and Python
- Extensive library of machine learning algorithms
- Support for big data and cloud environments
Altair RapidMiner is a data science platform that provides an integrated environment for data preparation, machine learning, deep learning, text mining and predictive analytics. It is designed for both experienced data scientists and those new to data analysis.
SAS
Key Features
- Advanced statistical and predictive analytics
- Data mining and machine learning
- High-performance analytics
- Data management and integration
- Customizable reporting and visualization
SAS is a software suite developed for advanced analytics, multivariate analysis, business intelligence and data management. It is widely used in various industries for its robust statistical analysis capabilities. SAS provides a comprehensive environment for data analysts to perform complex analyses.
Stata
Key Features
- Extensive statistical analysis capabilities
- Data management tools for large datasets
- High-quality graphics for data visualization
- Automation through scripting
- Comprehensive documentation and user community
Stata is a statistical software package used for data management, statistical analysis and graphics. It's widely used in academic and professional research settings. Stata offers a comprehensive suite of statistical tools for data analysts.
Cloud Data Platforms
Snowflake
Key Features
- Scalable cloud data warehousing
- Separation of storage and compute resources
- Support for structured and semi-structured data
- Secure data sharing capabilities
- Integration with BI and data integration tools
Snowflake is a cloud-based data warehousing platform that allows for the storage and analysis of large volumes of data. It separates storage and compute, enabling scalable and concurrent data processing. Snowflake supports various data formats and integrates with numerous BI tools.
Databricks
Key Features
- Collaborative notebooks for real-time code sharing
- Integration with Apache Spark for big data processing
- Scalable machine learning workflows
- Support for multiple languages (Python, R, Scala)
- Seamless integration with cloud storage solutions
Databricks is a unified analytics platform designed for big data and machine learning. It integrates with Apache Spark and provides collaborative notebooks for data scientists and engineers. Databricks simplifies the process of building and deploying machine learning models at scale.